Case study
We understand the operational and marketing challenges specific to each sector.
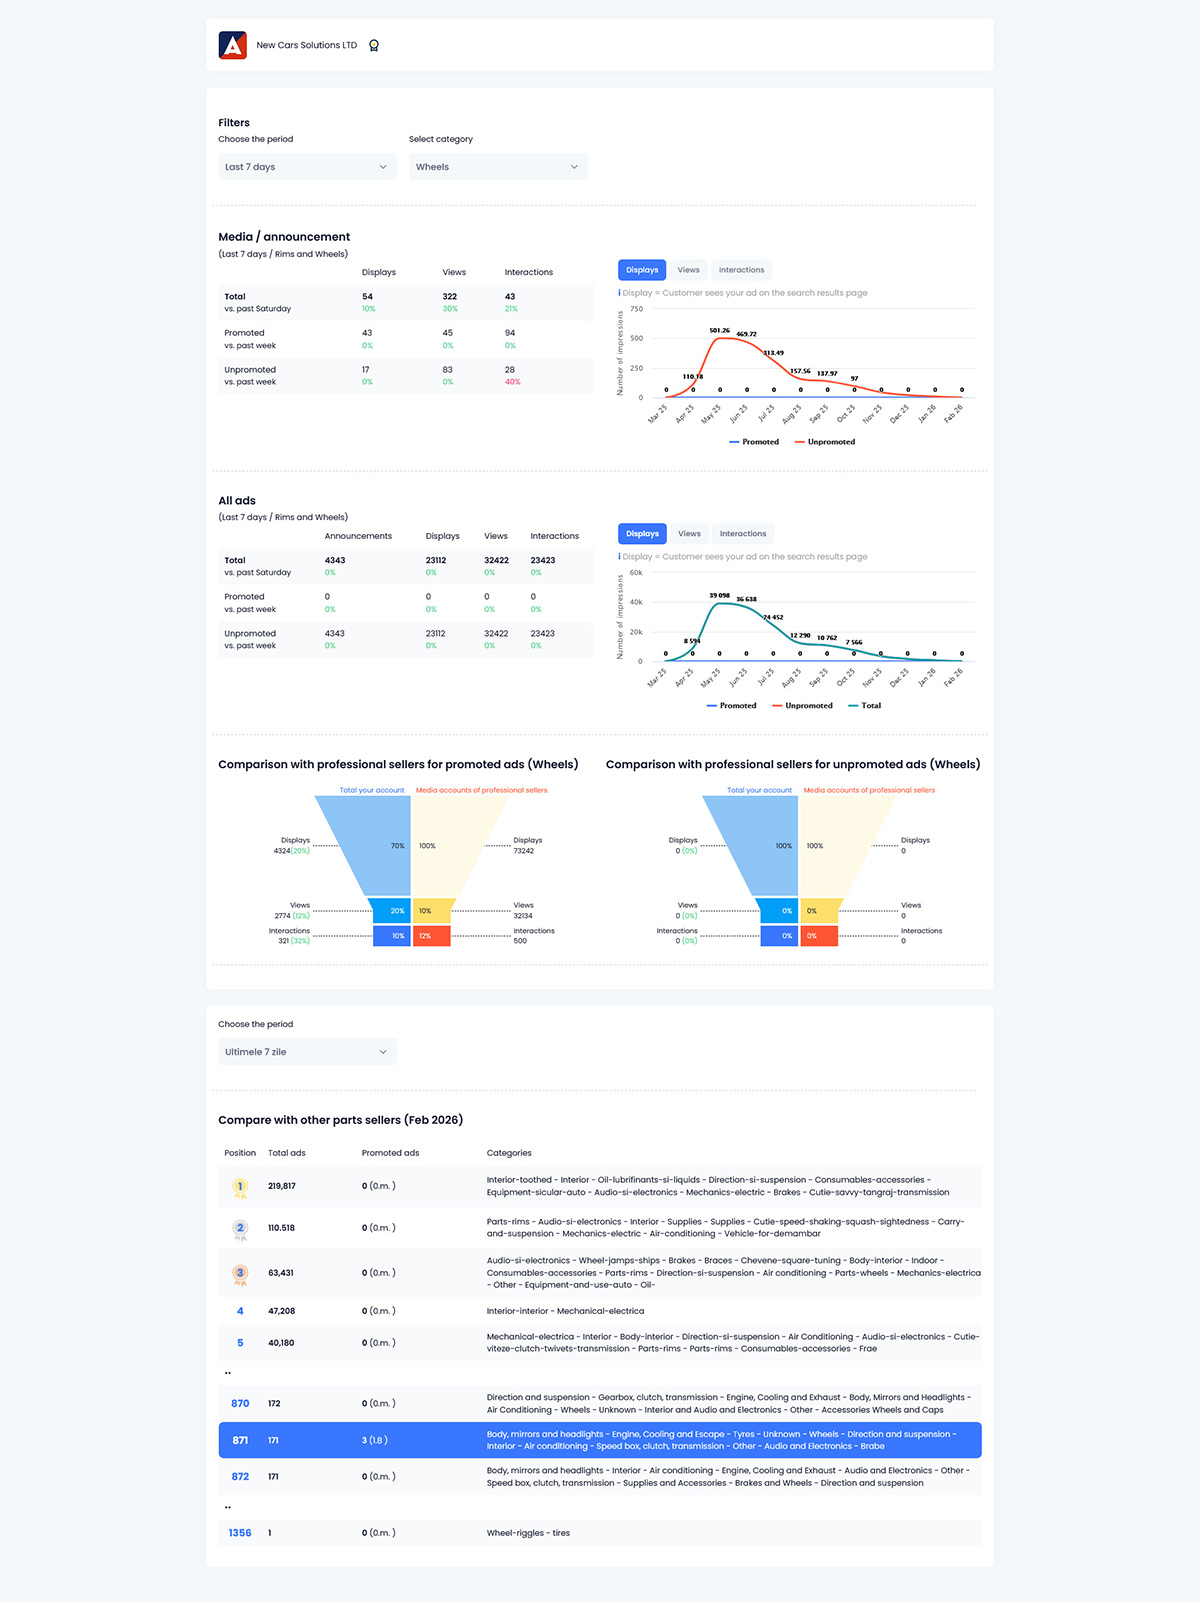
Performance reporting for premium sellers
| Project type: | Custom analytics & reporting platform |
| Client: | Autovit.ro |
| Industry: | Automotive marketplace |
| Role: | UX strategy, dashboard design, system architecture & backend development |
| Link: | undisclosed |
| Project lead: | Liviu Jurubita, Founder & Lead Developer, Webstone Studio |
| Services: | Interface & Design Systems, Web Product Engineering, Business-Driven Web Architecture, Integrations & Automation |
Context
Premium sellers invest consistently in promoted listings to increase visibility.
The objective was to build a reporting platform that transforms marketplace activity into meaningful insight. Not just numbers, but data visualization.
Sellers needed to quickly understand:
-
How promoted listings perform versus organic ones
-
How visibility evolves over time
-
Where engagement improves or declines
-
How they position themselves within their category
The system had to be simple to understand, even though the data behind it wasn’t.
Product & UX Approach
The website was designed as a decision dashboard and the UX focused on:
-
Clear visual hierarchy
-
Fast metric scanning
-
Consistent chart patterns
-
Logical grouping of data
Metrics were organized by intent: Visibility → Engagement → Comparison.
Instead of overwhelming users with tables, the interface guides them through performance layers.
Interactive charts allow trend recognition at a glance.
Comparison modules provide context.
Filters help isolate relevant time periods.
The design goal was clarity within complexity.
System Architecture
A dedicated reporting layer was engineered to generate personalized dashboards for each seller.
Access is secure and parameter-based.
The system operates independently from the core marketplace platform, ensuring:
-
Architectural separation
-
Controlled data processing
-
Independent scalability
Data ingestion is automated and optimized for aggregation efficiency, allowing historical performance analysis. The reporting logic focuses on structured comparison rather than raw extraction.
Reporting Capabilities
Each seller dashboard includes:
-
Total listings overview
-
Promoted vs non-promoted comparison
-
Displays, views and interaction metrics
-
Time-based performance evolution
-
Category-level breakdown
Interactive visualizations make trends immediately visible.
Impact
- Structured performance visibility
- Clear comparison between paid and organic exposure
- Decision-focused dashboard UX
- Secure, scalable reporting architecture
- Competitive context without data exposure
The platform transforms marketplace data into actionable insight.
Better visibility leads to better decisions and better decisions lead to smarter investment.
If you're building something that needs to perform, scale and last, let's talk.
Start a project
 Liviu Jurubita